Analytics: Report gallery and faster filters
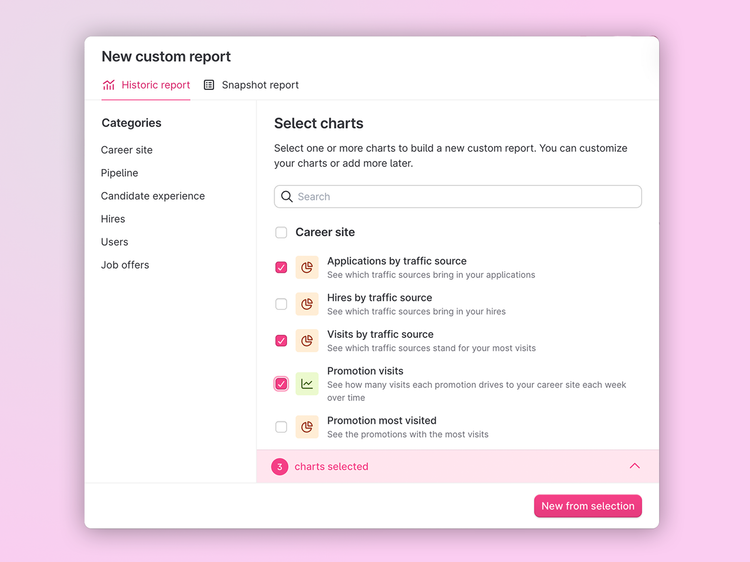
Pick your charts to create custom reports 📊 Brand new filters have also been added to the overview and standard reports.

Suzan Dil
Custom reports are really powerful, and we wanted to make them even easier to use. Create your report by adding charts and move them around as you wish. Putting together your own report has never been easier.
Pick your charts
You now have a library of preconfigured charts that work as a starting point. Get inspired and mix & match the charts you want to see. Move the different charts around to make sure that they are in the order you would like them to be.
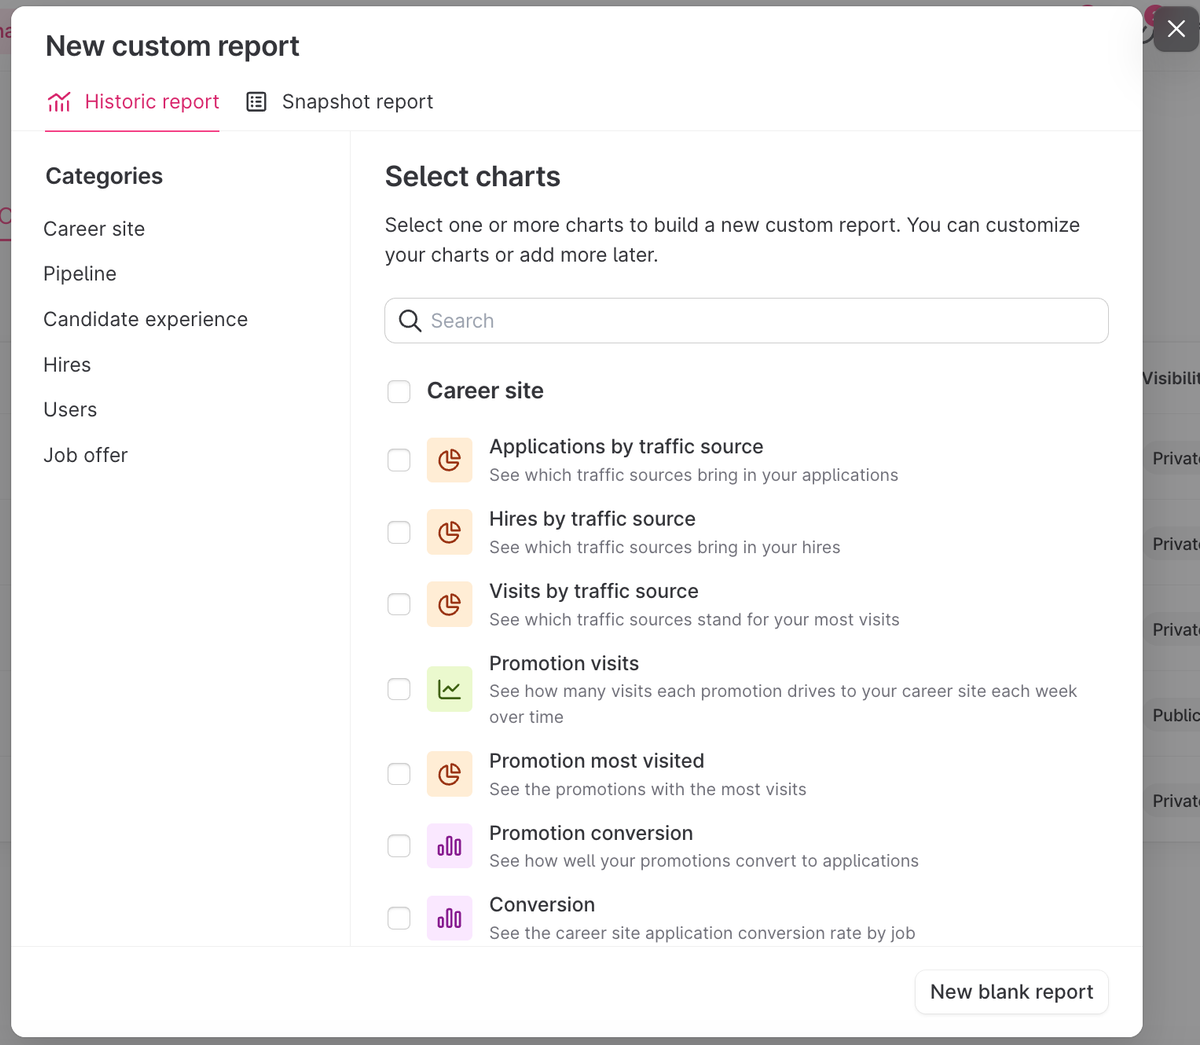
New and faster filters
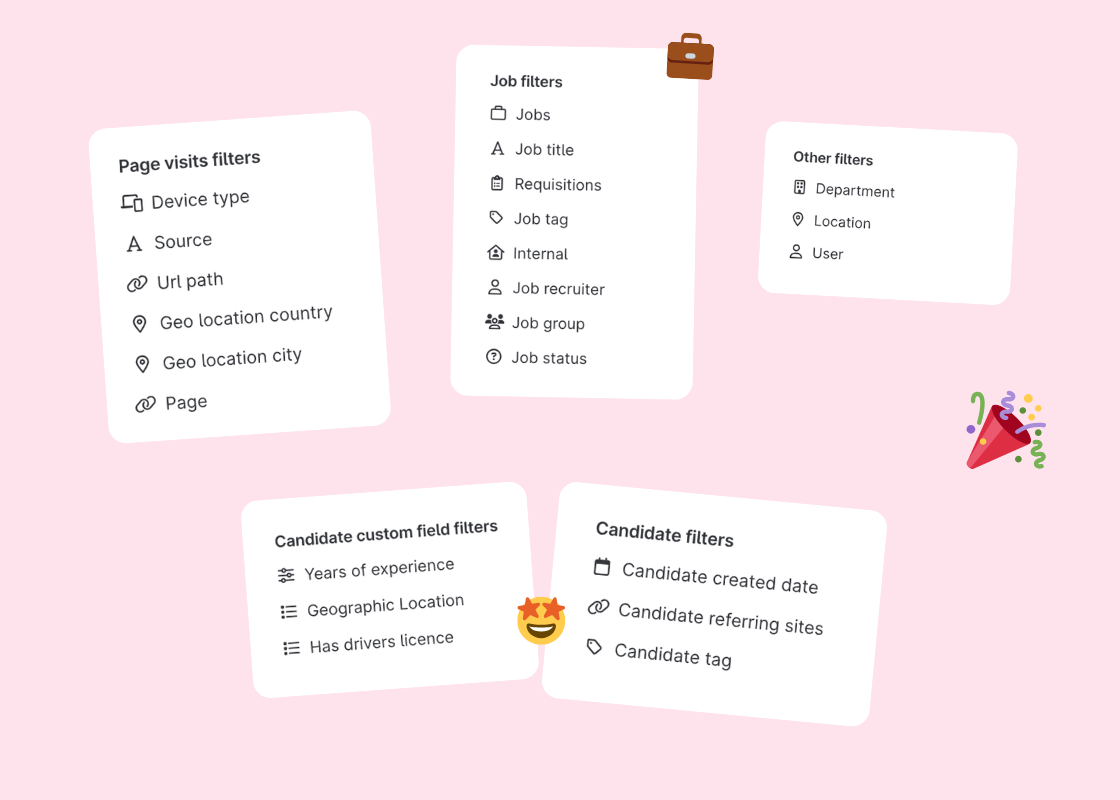
We've added the powerful filters from Custom reports to the Analytics overview and the Standard reports as well.
- Career site filters (pageviews, device type, and more)
- Candidate filters
- Candidate custom fields
- Filter by requisitions, user and job group
All filters have also been updated to work much faster.
Thanks for reading! Go to Analytics now to try it out.
❤️ / The Product Team
![]()
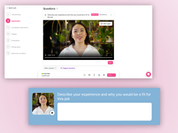
Ask candidates questions with a video 📹
Add short video questions in the job application form for a more personal candidate experience.
![]()
Teamtailor Product Updates 2025
Ask Co-pilot, Onboarding, Sign job offers and more. All the highlights from Teamtailor's updates and releases in 2025.
![]()
Your recruitment highlights from 2025 🥳
Take a moment to look at your year together with your team and celebrate your results.
