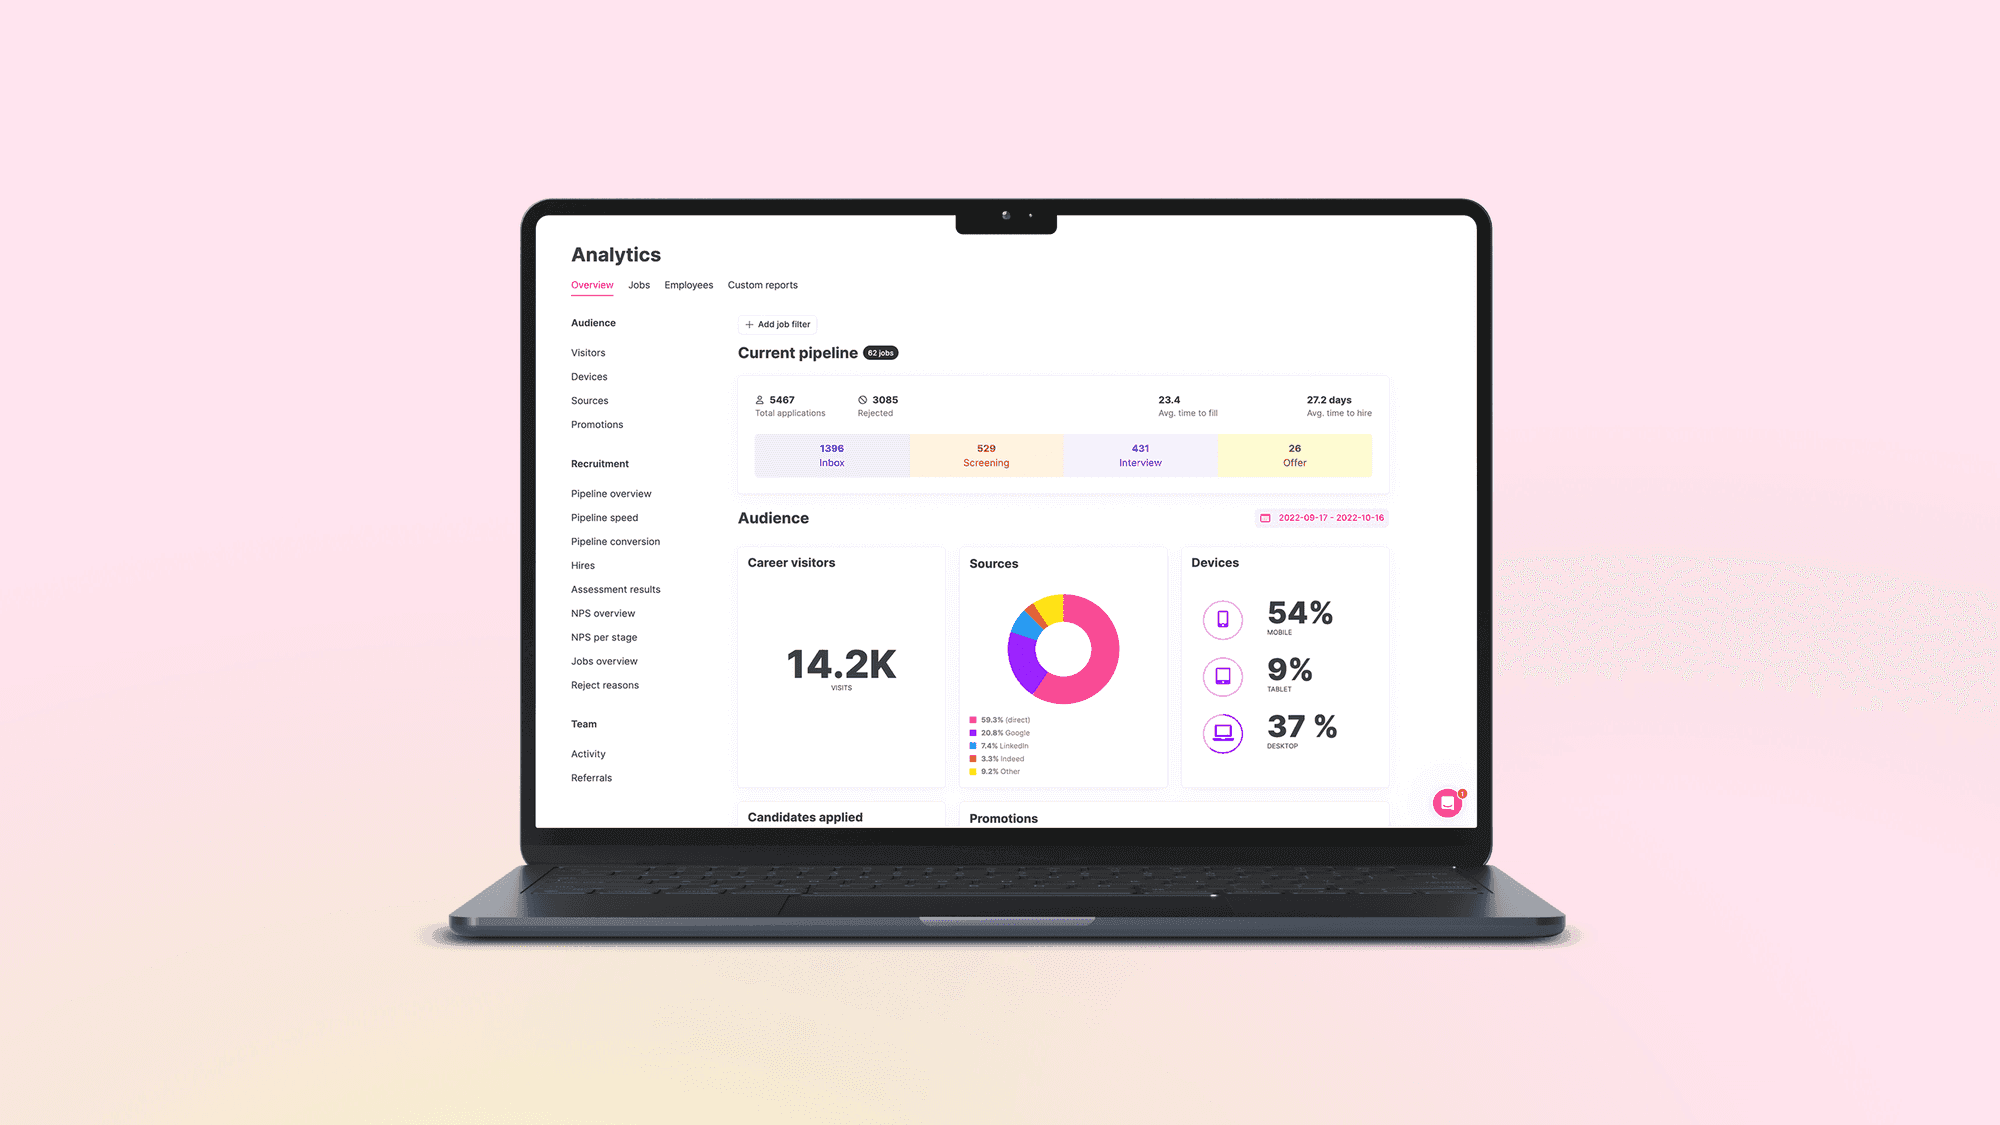


What recruitment metrics are, and what they are for
Recruitment metrics are the counts, durations and ratios that describe how a hiring process behaves: how long a role stays open, where candidates leave, which channel the hires came from, what the process costs. A KPI is a metric you have attached a target to. Most teams track a dozen metrics and hold themselves to three KPIs, and the useful work is deciding which three.
This guide is for teams that already report on time to hire and want the numbers to survive a conversation with a finance director or a sceptical hiring manager. It covers what each metric means, how it is calculated in Teamtailor and why two systems can give two answers for the same role. Where we describe how something works in Teamtailor, we say so. The definitions of the terms themselves are in the glossary entry.
Picture a recruiter who opens last quarter's report before a review and sees that the average time to hire has dropped. Nobody changed the process. Two slow roles fell outside the date range, and the average improved by arithmetic alone. This is an illustration, not a case, and it is the failure this guide is built around: a number that moves for a reason the team did not choose.
Benchmarks in this guide are quoted with their source and year. Where a source gave no figure for a metric, we say so instead of filling the gap.
Start from the question, not the metric
A list of thirty metrics tells you nothing. A short list tied to questions does. Each row below pairs a question someone in the business actually asks with the metric that answers it and the report where it lives in Teamtailor.
| Question | Metric | Where it lives in Teamtailor |
|---|---|---|
| How long does a hire take? | Time to hire and time to fill | Hires report and Pipeline speed report[S1] |
| Where do candidates leave? | Conversion and drop-off between stages | Pipeline conversion report[S1] |
| Which channel produces hires? | Source of hire | Hires report, split by source and department[S1] |
| Do candidates accept? | Offer acceptance rate | Custom report with offer counts[S2] |
| Was it a good hire? | Quality of hire | Quality of Hire evaluation, shown in the Hires report[S3] |
| What did it cost? | Cost per hire | Custom report on a cost field[S2] |
| Are candidates treated well? | Time to reject, NPS | Custom report and NPS report[S1][S2] |
If a metric has no question behind it, drop it from the monthly pack. It can stay available for the day someone asks.
Speed: time to hire, time to fill and time to reject
The two speed metrics are often used as synonyms. They are not, and the gap matters when a hiring manager and a recruiter disagree about how slow a role was.
Two clocks
Time to hire starts when the candidate applies. Time to fill starts when the job is published. In Teamtailor, time to hire is measured in days from the candidate's application until they are moved to the Hired stage, and time to fill is the average number of days from publication of the job until candidates are moved to Hired.[S1] A role that was published for three weeks before the right person applied has a long time to fill and a short time to hire. The first number tells the hiring manager how long the seat was empty. The second tells the recruiter how long the process took once someone was in it.
The KPI goal feature uses a third definition. When you set a time to hire goal, the clock runs from the candidate's entry into the inbox until hiring.[S4] The number on a goal widget and the number in the Hires report can therefore differ for the same candidate, and neither is wrong. Write the definition next to the number in any report that leaves the team.
What a benchmark can and cannot tell you
SHRM's 2026 recruiting benchmarking reports a median time to fill of 39 calendar days for nonexecutive positions, and says executive time to fill is unchanged from the year before.[S8] That is a useful orientation and a poor target. The page does not publish how SHRM defines the start of the clock, and your own mix of roles, countries and seniority will move the figure far more than the industry does. Compare your time to hire with your own last four quarters, split by job family.
The reject clock
The speed metric teams skip is the time it takes to say no. Teamtailor's custom report guidance puts it directly: a shorter time to reject generally means a better candidate experience.[S2] The Pipeline speed report shows average time to hire and average time to rejection at the top and the time spent in each stage type underneath, which is where the bottleneck shows.[S1]
The pattern worth looking for is one stage. Open the speed report and check whether most of the days sit in a single stage, often the one that needs a hiring manager's decision. The fix is not a dashboard. It is a conversation with that manager, and the dashboard is what makes the conversation short.
The funnel: apply rate, conversion and drop-off
A recruitment funnel turns the process into ratios. The ratios are only as good as the stages behind them, which is why they are the first thing to break when two teams name their stages differently.
Three ratios worth keeping
- Apply rate. Visits that become applications. In Teamtailor's Jobs overview, conversion rate is applications divided by visits, and a job counts as active when it has at least one visit or application.[S1] A low rate on a well-visited ad points at the ad or the application form, not at sourcing.
- Stage conversion. The share of candidates who move to the next stage. Subtract it from 100 per cent and you have the drop-off rate for that step.[S1]
- Reasons for rejection per stage. A custom report can show not only why candidates were rejected but at which stage, which separates a screening problem from a late-stage one.[S2]
Cohorts, not snapshots
The Pipeline conversion report in Teamtailor is cohort-based: only candidates added within the selected date range are included.[S1] That is the right behaviour for a funnel, and it means a candidate who applied in March and was hired in May belongs to March. When a report for April looks thin at the bottom of the funnel, the candidates have not got there yet. Read funnel numbers a full process length after the cohort started, not the week after.
The Pipeline overview report works differently. It shows candidates moving through the process from a daily snapshot by stage type, taken at 2:00 AM CET.[S1] Use it to see where the pipeline stands today and the conversion report to see how a cohort behaved.
Source of hire and cost per hire
These two metrics are the ones finance asks about, and the two where a definition changes the answer most.
Source of hire
Source of hire counts where the eventual hires came from, not where the applicants came from. A job board that sends two hundred applicants and no hires is a different line item from a referral programme that sends five and hires two. In Teamtailor, the Hires report breaks hires down by source and by department in two charts.[S1]
Two practical points. First, the source is only as honest as the habit: a candidate a recruiter found elsewhere and then asked to apply may be recorded as an application. Agree internally when something counts as sourced. Second, look at source of hire next to the share of applicants who reach the later stages. Teamtailor's own guidance on job posting performance makes the same point: the more candidates you have in the final stages, the more efficient the source.[S2]
Cost per hire
The formula is short: total recruitment cost divided by the number of hires in the same period. The argument is about what goes into the total. Recruiter salaries, agency fees, job board spend, software, interview time and background checks are all candidates for inclusion, and a figure that counts one team's costs cannot be compared with one that counts another's. In Teamtailor, cost per hire is built in a custom report from a cost field on the application, filtered to hired candidates.[S2] That keeps the arithmetic visible and puts the definition in the hands of whoever sets the field.
SHRM's 2026 benchmarking says executive cost per hire increased while nonexecutive cost stayed relatively stable, and the public page gives no figure.[S8] Quote the direction if you need to, and keep the euro or dollar figure for your own data.
Quality of hire and candidate experience
Speed and cost describe the process. Quality and experience describe what it produced.
Quality of hire without waiting a year
The common objection to quality of hire is that it takes a year to know. A lighter version can start earlier. In Teamtailor, you add a Quality of Hire trigger to a Hired stage, and after a set period the job's main recruiter, or a user an admin chooses, gets an email asking "Would you hire this candidate again for this role?" with a Yes or No answer and room for feedback.[S3] Results feed the Hires report, where each hire is marked Good, Pending, Poor or Not sent, and the report shows the percentage of Good evaluations among Good, Poor and Unknown ones. Pending and unsent evaluations are excluded from that ratio.[S3]
The question is deliberately small. It does not replace performance data or retention figures, and it will not tell you why a hire went wrong. It gives you a rate that exists for every hire, which is more than most teams have. Pair it with the guidance in how to improve quality of hire when you want the longer view.
Offer acceptance
Offers declined are a metric about the end of the process, and they usually trace back to the start: a salary range stated late, a long silence after the last interview. Teamtailor's custom reports can count offers created, sent and accepted, which gives you the numbers for offer acceptance rate, though the help article gives no ready-made rate formula, so you divide accepted by sent yourself.[S2]
Candidate experience
The measurable part of candidate experience is smaller than the feeling. Time to reject is one number. The NPS report in Teamtailor, with Net Promoter Scores and candidate feedback, is another.[S1] Read the free-text feedback before the score. A recruiter who reads thirty comments about the same unanswered email learns more than the average ever shows.
Choosing the three that go on the front page
The answer to "which three metrics do we track?" depends on what the team is trying to fix. A reasonable default for a team of ten to forty recruiters is one metric for speed, one for the quality of the pipeline and one for the result.
- Time to hire, by job family. It shows whether the process is slowing down and gives the hiring manager a number they can influence.
- Stage conversion at the stage that worries you most. One ratio, chosen because it is where you lose people. Change it when the problem moves.
- Quality of hire ratio, or offer acceptance. One outcome measure, so that speed is never the only story.
Source of hire and cost per hire belong in the quarterly review with finance, where budget is the topic. They are poor weekly numbers because one hire moves them.
Two phrases that surface in searches for this topic are not metrics. There is no standard list of the "5 C's" of recruitment, and the "70/30 rule" comes from sales training, where the prospect talks 70 per cent of the time and the seller 30.[S10] Neither can be counted in a report, so keep them off the dashboard.
Targets inside the system
Teamtailor lets admins set company-wide goals under Settings, Analytics, Goals, for job ad conversion, time in inbox, the share moved forward from the inbox, and time to hire. A goal can be "above", "between" or "below" a value.[S4] The goals show next to the KPIs under Analytics, Overview, KPIs and Job goals, can be filtered by department or location, and jobs that miss a goal are listed under "Jobs outside goal". Each week, hiring teams also receive a performance snapshot for their job in the job comments, with the goals shown alongside if they exist.[S4] The weekly snapshot is where a hiring manager meets the number without opening a report.
Getting the data right before you present it
Most arguments about recruitment metrics are arguments about data. A short routine before a review saves the meeting.
Check the definitions
- Which clock is this: application, publication or inbox entry?
- Is it a cohort or a snapshot?
- Do the stages mean the same thing in every team? If one team uses Hired for a signed contract and another for a verbal yes, the comparison is meaningless.
- What period is included, and how are roles that closed after the period handled?
Know the limits of the tool
In Teamtailor, reports are available with a one-day delay, so the current day is not included.[S5] The default period is the last 28 days, and the filters are applied together.[S5] A few reports appear only if you use the feature behind them: Assessment results need an integrated assessment partner, and Onboardings need the Onboarding add-on.[S1] Access to the reports sits with Company Admins, Recruitment Admins and users with the Analytics role add-on, and everyone on a hiring team can see the reports for their own job.[S5]
Put the definition in the report
Custom historic reports in Teamtailor let admins build bar, line and pie charts and data tables, and the tables include historic data that the snapshot leaves out, for example on deleted candidates.[S6] Charts cannot be exported to CSV, only the data tables can.[S6] Reports are private by default, can be shared with all admins, and can be scheduled by email to internal and external recipients, with a PDF attached.[S6] Name each report with its definition in the title, so the version that reaches a finance director carries its own footnote.
Running the review with hiring managers
A metric that stays in the TA team changes nothing. The review is where it turns into a decision, and it works best when it is short and has a fixed shape.
- One page per hiring manager group. The three KPIs, the trend over four quarters and the jobs outside goal.
- One question per number. If time in the shortlist stage doubled, who owns the next step, and what would make it quicker?
- One change per month. Choose one process change, write down the metric you expect to move and the date you will look.
A good review ends with a sentence rather than a chart, for example "interview feedback within two days, we look again in June." That sentence is the output. The report is the evidence behind it.
The article on using recruitment analytics to reduce time to hire goes further on the speed side. For the funnel, the glossary entry on the recruitment funnel lists what to map first.
Next steps
Download. The Recruitment Metrics Guide collects answers from 100 HR, recruitment and talent professionals.
Pick the three metrics, write down the definition of each in one line and check that the stages in your process mean the same thing for every team. Then look at how the reports work in the product: the reporting and recruiting metrics page lists the KPIs and the custom reporting, which Teamtailor describes as including data that updates instantly and reports you can export or share across the organisation.[S7] To see the Hires report, the Pipeline speed report and the goals set up on your own roles, book a demo. If cost is the question, the pricing page lists what is included.